Most sports prediction products are black boxes. You get a number. No explanation. No methodology. You have no idea if it came from a real model, someone’s opinion, or worst an AI “prediction”.
PredictApp is built to work differently. This article is the accessible explanation of our goals model that powers all four market predictions (both teams to score, over/under goals, clean sheet probability, and team total). Here is the full three-layer system, without all the math difficulty.
Layer 1: RWI: Four Team States Before Kickoff
The first layer of the model is the Roiz Walss Index (RWI). It is a structured pre-match signal I built from the most fundamental question in soccer analytics: how strong is each team, right now, for this specific match? You can find a full explanation of how the RWI is built here.
Standard rating systems like Elo use a single number per team. That is useful for rough team rankings, but it compresses important information. A team can be strong at home and fragile away. Strong in attack and leaky in defense. For this reason, team indexes are not the best if you want to predict goals. RWI solves this issue by tracking four separate states for every team:
- AH (Home Attacking Strength): How well this team creates goals when playing at their own stadium.
- DH (Home Defensive Weakness): How easily this team concedes goals at home.
- AA (Away Attacking Strength): How well this team creates goals on the road.
- DA (Away Defensive Weakness): How easily this team concedes when playing away from home.
These four states are updated after every match. The rating recalibrates after every game the 4 states of both teams involved. If a team loses three key defenders to injury and their defensive results change, the DH rating reflects that in the next round’s predictions.
Why four states instead of one?
Imagine this: A team has won all the games played at home and has managed some away wins and draws. These results make our team be in the top 5 teams in the league.
Now, lets add some more context and imagine this: our team scores 2.12 goals per match at home, but only 0.8 goals per match away. Its clear that our team does not have the same attacking strength when playing at home than away. Its also clear that the venue changes the context .
If you would be using a single index number, like ELO, then your team will be very strong as its getting positive results and accumulating points. But, as we know, the team is just not as prolific when playing away. So using a single index would probably give you higher expected goals for our team when they play away. Our RWI four-state structure is what lets our model handle home and away games separately, which is exactly how soccer actually works.
Lineup awareness
RWI is also lineup-aware. Every player has a stabilized individual value built from their minutes played and position group. When a key striker is missing, the team’s attacking rating adjusts. When a first-choice goalkeeper is back from injury, the defensive rating reflects that. Its not using fixed squad ratings. The model uses the actual lineup for the specific match.
League awareness
A 2.1 expected goal difference in the Bundesliga does not mean the same thing as a 2.1 in the Copa Libertadores. The Bundesliga scores more per match on average (3.16 vs 2.45 goals per match).
RWI uses league specific priors: average goals per team, home advantage, and goal-difference dispersion are all calculated separately per league. This is what makes multi-league modeling work. The signal is calibrated to the competition it comes from.
RWI goal outputs
RWI as a stat is a single number, expected goal difference for the match. And this is what is used for the outcomes model. But to predict how many goals will a team score you don’t need the differential. So, I took the previous output from RWI which is the mean expected goals for each team to score in a given match.
Layer 2: The Blended Goals Model
RWI is a great place to start but its not the final model. It is a pre-match signal that the second layer uses as its primary input together with match context features.
The second layer is a blended goals model. It predicts two numbers: the expected home goals mean and the expected away goals mean for the specific fixture.
Four model families, then a blend
During development, I benchmarked four types of models on walk-forward cross-validation across multiple seasons:
- Poisson GLM: a classical statistical approach to count data like goals. Interpretable, stable, and generalizes well.
- LightGBM: a gradient-boosted tree model that captures nonlinear interactions between features that the GLM misses.
- CatBoost: another gradient-boosted model with strong handling of categorical features and a different training approach than LightGBM.
- Ridge regression: a regularized linear model that performs well when the signal is approximately linear but the feature space is wide.
Each model family was trained separately for home goals and for away goals. I evaluated them on home goals MAE, away goals MAE, total-goals MAE, Poisson deviance, and exact score hit rate.
No single model family dominated across all metrics. The Poisson GLM performed best on calibration. LightGBM captured some nonlinear patterns the GLM missed. CatBoost and Ridge contributed to MAE and exact score hit different conditions.
The final production model blends all four. The blend is more reliable than any individual model because different families make different kinds of errors, and averaging across those errors reduces overall variance.
Walk-forward validation:
Finally, every model in the blend was trained using walk-forward validation to avoid data leakage.
This means each season’s model was trained only on data from previous seasons. For example, train on seasons 2018-2024 and predict season 2025. This is to assure that no future information is leaked into the training data. It is easy to accidentally train a model that looks great in backtesting but uses information that would not have been available at prediction time. Walk-forward validation prevents this.
So now our blended model outputs a predicted home goals mean and a predicted away goals mean. These are the inputs for the third layer.
Layer 3: Dixon-Coles: From Goals to Probabilities
Predicting that Team A will score 1.8 goals and Team B will score 0.9 goals is useful, but its very misleading. Although the model is accurate and has good evaluation metrics, the exact goal prediction is no useful for users.
Why is the exact prediction not useful for users?
The reason is simple, sports are non-deterministic. Meaning that questions like who is going to win? or how many goals will the home team score? Can not be answered with 100% certainty. For example, mathematics are deterministic. This means that 1+1 is always going to be 2 with 100% certainty.
As sports are not deterministic, there is no model in the world that can guarantee the result of a match before it starts. Any “analysis” that tells you otherwise is a lie.
This is why what PredictApp shows users is a probability: a percentage chance that both teams score, or that the match goes over 2.5 goals, or home team scores more tan 1.5 goals. So, that the user can understand what is probable and what is the risk.
So, getting from mean predictions to those probabilities requires the third layer: a Dixon-Coles probability layer.
The basic approach
If you treat home goals and away goals as two independent Poisson processes (which is a reasonable approximation) (we also tested non independent probability transformation, independent performed better), you can calculate the probability of any specific score.
Probability the home team scores exactly 2 given the predicted mean is P(2). Probability the away team scores exactly 1 given the predicted mean is P(1). Multiply them. That is P(21). Do this for every possible score combination, and you have a full score probability matrix. Sum probabilities you are interested in and you get your market probabilities.
Why Dixon-Coles specifically?
The independent Poisson assumption slightly underestimates low scoring draws and slightly overestimates other low-scoring outcomes. Dixon and Coles (1997) proposed a correction parameter that adjusts low scoring score line probabilities to better match real data.
I benchmarked the Dixon-Coles method against several alternative probability-construction approaches. The result was that Dixon-Coles produced the best overall balance between performance and simplicity. It is also well-understood in academic soccer statistics, which matters for transparency.
One distribution, all markets
This is the key insight of the third layer. Once you have the full score probability matrix, every market probability follows from the same source:
- BTTS probability = sum of all scores where home goals > 0 AND away goals > 0
- Over 2.5 goals = sum of all scores where home goals + away goals > 2.5
- Under 2.5 goals = sum of all scores where home goals + away goals < 2.5
- Home clean sheet = sum of all scores where away goals = 0
- Away clean sheet = sum of all scores where home goals = 0
- Team goals probabilities = sum of all scores where the team scores > the amount of goals.
All from the same matrix. All internally consistent. Our Probabilities come from the same underlying score distribution and are mathematically constrained by each other. So, you can not have crazy things like the away team has 40% probabilities of scoring but both teams to score has 65% of probability.
How Does the Model Benchmark?
I benchmarked the model against bookmaker-implied probabilities on matched samples, using log loss and Brier score.
The results: the goals model operates at bookmaker level or better:
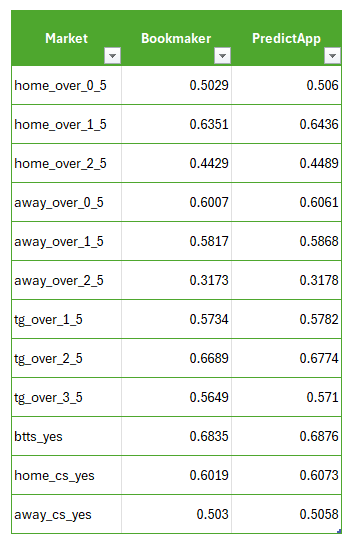
In conclusion, every probability shown in the app comes from the same coherent model and provide probabilities that compete with the best models.
When you open a prediction card and see:
- RWI expected goal difference: that is Layer 1, the pre-match team strength signal.
- BTTS, over/under, and clean sheet probabilities: those are Layer 3 outputs from the full score distribution that Layer 2 generated.
- Outcomes probabilities: coming from the outcomes model using the same RWI (explained here)
I built PredictApp on the principle that a prediction you understand is more useful than one you cannot. The RWI number on the card, and the probability percentages are all windows into the same model. The model is doing the work. You are seeing the output, and now you know what is behind it.
See the model’s analysis before every match
Explore the Markets
The goals model powers predictions for all four markets available in the app:
Both Teams to Score Predictions: BTTS probability from the same score distribution
Over/Under Goals Predictions: match total predictions driven by RWI goal difference
Clean Sheet Predictions: defensive weakness ratings and clean sheet probability
[…] How PredictApp’s Goals Model Works […]
[…] – How PredictApp’s Goals Model Works […]
[…] How PredictApp’s Goals Model Works […]