Both teams to score sounds simple. Did both sides score at least once? Yes or no.
Getting it right is not simple at all.
The thing is BTTS does not depend on one signal. It depends on two independent conditions being true at the same time. Basically you need to get right 2 different predictions. That difference is why BTTS is harder to predict than match totals, and it is exactly where a model approach has the most value.
What BTTS Actually Requires
BTTS is whether both teams score at least one goal during the 90 minutes of regular time. Extra time does not count. Penalties do not count.
Basically any final score that includes a 0 is not BTTS. What this means: a match can produce plenty of goals without hitting BTTS. One dominant performance can score three times and still not hit the market if the other side is completely shut out.
BTTS is about both attacks overcoming both defenses. That is the constraint.
The Two Conditions the Model Checks
Our first layer is RWI tracks four states for every team:
- AH (home attacking strength): how well this team creates goals at home
- DH (home defensive weakness): how easily this team concedes at home
- AA (away attacking strength): how well this team creates goals on the road
- DA (away defensive weakness): how easily this team concedes away from home
For BTTS, the model checks two conditions simultaneously:
Condition 1: Does the home team score?
The home team’s attacking output depends on their AH (home attacking strength) against the away team’s DA (away defensive weakness). Strong home attack + weak away defense = the home team is likely to score. This is then passed through our models to get a final expected goals predictions for the home team.
Condition 2: Does the away team score?
The away team’s scoring potential depends on their AA (away attacking strength) against the home team’s DH (home defensive weakness). Strong away attack + weak home defense = the away team is likely to score. This also passed through our models to get a final expected goals predictions for the away team.
Our predictions are then transformed into probabilities. We then have to multiply the probabilities of Condition 1 and 2 to get BTTS probabilities. Both conditions must be true for BTTS to hit.
This is the structural difference from over/under. Over 2.5 goals only needs the combined total to exceed 2.5. One team producing a hat-trick can do that without the other side contributing anything. BTTS needs both sides to score. Two independent events must co-occur.
That co-occurrence requirement is what makes BTTS harder to calibrate than match totals.
Which Stats Actually Predict BTTS?
Beyond the core RWI ratings, several supporting signals help the model:
- Squad value: This is rather straight forward, when the value difference is too high then the team with lower squad value may struggle to score. There are some more nuances but that is a general overview.
- Head-to-head history: Historical patterns between specific clubs carry weight, not because the past guarantees the future, but because tactical matchups between the same opponents tend to repeat. For example no matter how good are both Milan and Juventus playing, from 2020 to today (04.2026) they have played 12 times and only 3 games have finished with BTTS.
- League environment: Leagues scoring environment’s are different. Some leagues are high scoring and some leagues are not. The model uses league-specific priors so that BTTS probabilities are calibrated to the scoring norms of the league, not just the individual team ratings.
Why BTTS Is Harder to Predict Than Match Totals
Being honest about this matters.
BTTS is the hardest market in the goals model. The scientific paper underlying PredictApp’s modeling framework says this directly: BTTS requires two independent events to co-occur, which adds structural variance that other markets do not have.
Over 2.5 goals is easier to model because the outcome only depends on total goals exceeding a threshold. One team scoring three can do that. The prediction is about quantity.
BTTS requires both attacks to fire against both defenses. That is a harder condition to satisfy, and it is harder to model accurately even with strong signals like RWI.
Our four RWI states give genuine information about how both attacks and defenses compare to the model. But inherently BTTS predictions carry more uncertainty than over/under predictions.
Presenting this honestly is the point. A calibrated 55% BTTS probability is meaningful. A claimed 90% BTTS “sure thing” is not real.
Which Leagues Have the Highest BTTS Rates?
BTTS rates vary significantly by competition, and the model accounts for these differences through league-specific calibration.
- Bundesliga: From our data since 2018 the German Bundesliga is the league that has a higher BTTS percentage with 59.6%
- MLS: MLS is a close second achieving 59.3%
- Liga MX: Liga MX profiles as the 3 league with most games with BTTS with 54.5%
- Serie A: Historically a low scoring league, but as we said BTTS is not about total goals, is about both teams scoring. Italian Serie A comes in in 4th place of BTTS with 54.1%
- Ligue 1: The fifth place for leagues with higher BTTS rate is France’s Ligue 1 with 53.3%
You can find the complete league stats in our app here.
How to Read a BTTS Signal in PredictApp
Open any prediction card. You will see:
- Outcomes Probabilities
- BTTS, Clean Sheets, Total and Team goals probabilities
- Team Stats
- League Context
Lets explore how to read a probability. Here is a match for the MLS:
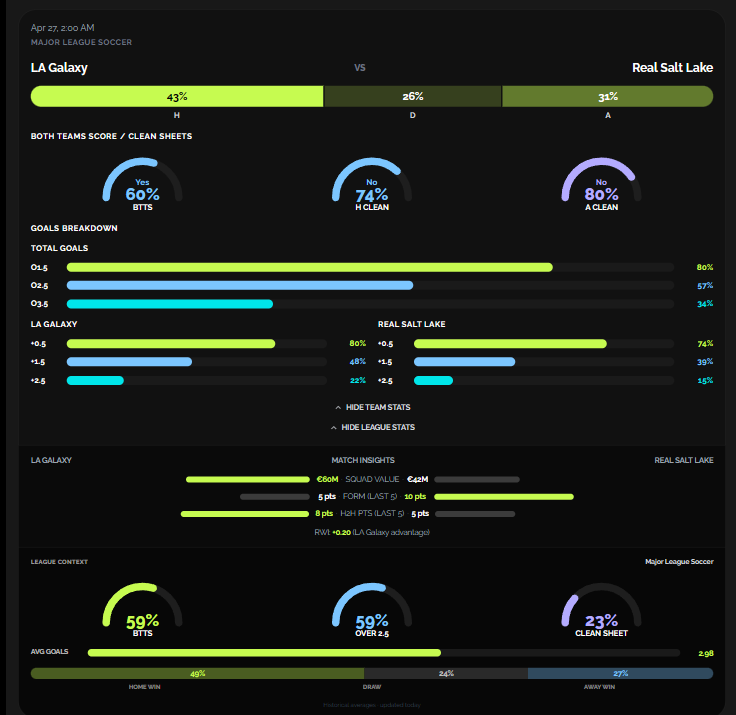
Here is what I see:
- As you can see BTTS has a 60% probability. That is really high for a BTTS prob.
- The outcome probability is not leaned very highly to any side, meaning this game should be rather close.
- Both teams probabilities to score over 0.5 goals are high.
- Real Salt Lake is coming in a better form than the home team Galaxy. Which is good because that could mean they might have the firepower to score as a visiting team.
- League context is telling us that this league has 59% of its matches finishing with BTTS yes. Also, the average goals for the league is quite high with ~3 goals.
In general I like the probabilities for this game to finish with both teams scoring.
See BTTS Analysis for Today’s Matches
FAQ
What does BTTS mean in soccer?
Both teams to score. The market settles on whether both teams score at least one goal during the 90 minutes of regular time. Extra time and penalties do not count.
How do you predict both teams to score?
We use a 3 layered approach that first measures team strengths in 4 dimensions (home attack, home defense, away attack and away defense). Second it generates expected goals. Third those expected goals are converted into a scoring matrix. Lastly we multiply the probabilities of both teams scoring more than 1 goal to get BTTS probabilities.
Which leagues have the highest BTTS rate?
- Bundesliga: From our data since 2018 the German Bundesliga is the league that has a higher BTTS percentage with 59.6%
- MLS: MLS is a close second achieving 59.3%
- Liga MX: Liga MX profiles as the 3 league with most games with BTTS with 54.5%
- Serie A: Historically a low scoring league, but as we said BTTS is not about total goals, is about both teams scoring. Italian Serie A comes in in 4th place of BTTS with 54.1%
- Ligue 1: The fifth place for leagues with higher BTTS rate is France’s Ligue 1 with 53.3%
Does extra time count for BTTS?
No. The BTTS market closes at the end of 90 minutes of regular time.
What is a good BTTS percentage?
There is no universal threshold. A 63%+ reading indicates the model sees strong signals on both sides. Below 40% suggests one or both defenses are likely to hold. The number is a calibrated probability, not a guaranteed call.
Read More
- BTTS Hub: Both Teams to Score Predictions by League
- How PredictApp’s Goals Model Works
- Back to Soccer Hub
—
*Match analysis is for informational purposes only. The model is validated on 39,042 matches but no prediction is guaranteed.*